ERNEST MOYER'S RESEARCH
THE FOURTH DYNASTY
GREAT PYRAMIDS OF EGYPT
GEOGRAPHICAL ORIENTATIONS
And
SIDE DEVIATIONS
PART FOUR
Copyright 2001, by Ernest P. Moyer
Correlation of the Orientations and Side Deviations
The linear regression lines on the natural logarithm plots of both the compass orientations and the mean side deviations of the Egyptian pyramids, when plotted against the pyramid numbers, show that they are mathematically (not physically) related to one another. This relationship is expressed by the equation
ln (Dev) = -1.27 + 1.17 ln (Or)
where I substituted the numerical values for the intercepts and slopes.
With explicit statement of all elements the expressions are
as follows:
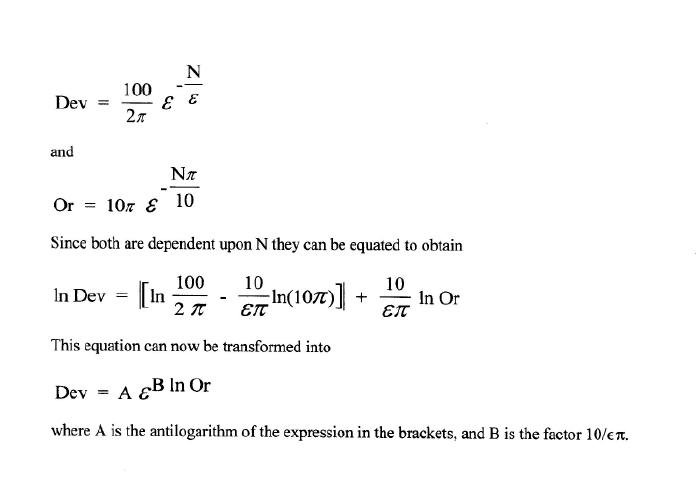 |
Note that if B = 1 the expression devolves to Dev = A(Or). This is extremely interesting for it means that the side deviations are linearly related to the orientations when B = 1. If B is slightly different from 1, the relationship over small numbers might appear as linear.
When I first examined the relationship between the two I did not derive the rigorous mathematical form above. I simply plotted the numbers from Table II against one another.
Figure Five show this plot with the mean of the absolute
side deviations (folding the negative side of Figure Two over to the positive
side) in parts/10,000 against the mean orientation in minutes of arc west of
north for each structure, This is a linear plot, not a logarithmic plot. (The
plot may appear as linear because B = 1.17.)
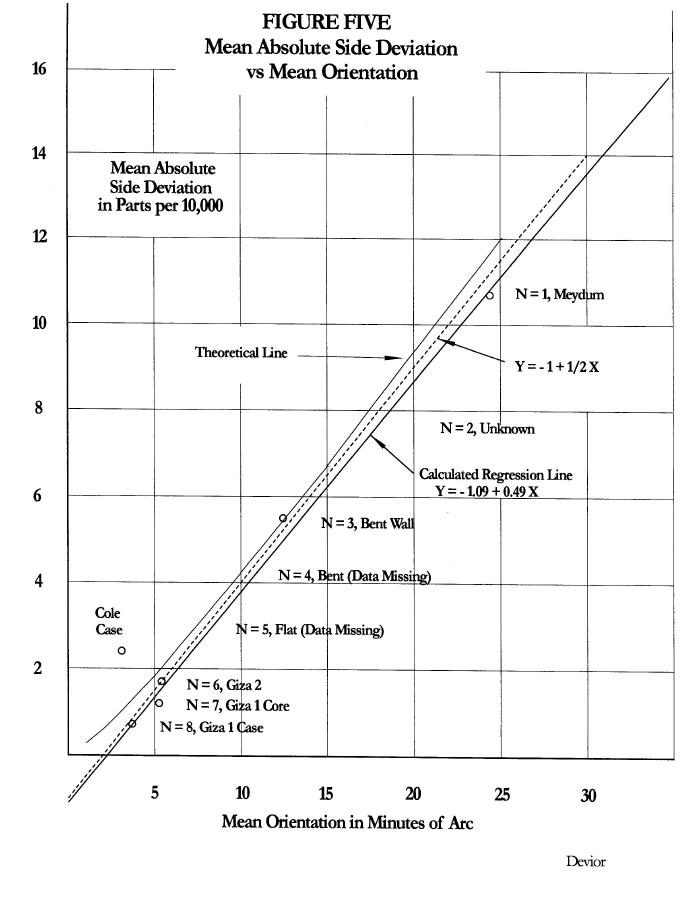 |
This graph shows the strength of correlation for five structures with measurements all from Petrie. No structure departs more than 5 parts/100,000 on average difference in base length nor more than one minute of arc in orientation from the calculated regression line. The calculated slope is 0.49 parts/10,000 per minute of arc. The calculated intercept on the abscissa is 2.2 minutes. This is the asymptote for Figure 1.
Figure Five raises crucial questions. Its meaning must be clearly understood.
If the side deviations and the mean orientations are physically independent of one another the strong linear correlation of Figure Five must be due to conscious human control.
When I first plotted the points, without benefit of the derivation, I was surprised at the strength of the correlation. The correlation certainly could not be due to accident. Some might feel that the three Giza structures, as a group, are not distributed sufficiently to demonstrate correlation. Then there would be only three data points showing correlation, not five. This view assumes unrelated randomness and normal distribution in the data. However, the calculated correlation coefficient for all five data points is 0.997. If we group the three Giza structures together and take their mean value, the calculated coefficient for their correlation with the Bent wall and Meydum is 0.998. Even more, the calculated correlation coefficient for the three Giza structures as a group alone is 0.905. Regardless of how we group the data a high degree of correlation exists among them. The mathematical equations above show that the strong correlation is not accidental.
From the mathematical derivation we can recognize the
degree of intelligence necessary to create the correlation.
Some might still argue that the correlation may be due to an
inherent relationship in control that caused the sides length deviations to
become smaller as the compass orientations improved. But as I described
above, there is no organic cause why this should be so. The small relative
size of the deviations compared to the side lengths do not support such claim.
Clearly there is a strong, and clever, intelligence on display.
The strong linear correlation cannot be due to anything but design intent. A predetermined goal of maintaining construction control within exact equivalent limits of side deviation and compass orientation was executed by the builders. The correlation could only be by conscious planning and not merely to uncontrolled improvements in measurement techniques. How could the builders of Meydum independently have caused the side lengths to deviate from the mean length in a manner related to mean orientation that would later correlate with the Bent enclosure wall, Giza 2 and Giza 1 strictly by accident?
The calculated regression line is very near an analytic ideal. The dashed line on the graph shows the relationship of Y = -1 + 1/2 X, where Y is side deviation in parts per 10,000 and X is minutes of arc. Of course, there can be no negative intercept for absolute values. I am merely extrapolating to the ordinate to determine the equation of the line. This equation requires that the builders calculated deviations in parts/10,000 and minutes of arc in angle.
The designer could “pull” the Giza values slightly to reinforce the linear regression of Figure Five, while not upsetting the slopes of Figures Three and Four.
One can see how the designer must have played with the numbers, seeking both intercepts on Figures Three and Four, and slopes, to provide numbers that would give the simple equation on Figure Five, while still making the numbers based on ? and ? apparent to later investigators.
The proposed theoretical regression line is only 2% from the line calculated from the measured values; the intercept is in similar proximity. The difference may be due to our measurement limitations and not due to the construction limitations of the builders. In other words, the builders are testing the limits of our modern measurement methods.
If we accept that the pole position has moved 0.2' or 0.3' since construction of the pyramids 4500 years ago the calculated regression line falls even closer to this analytic ideal.
The simplicity of -1 for the ordinate and a slope of ½ certainly are not natural or accidental numbers. But this has dramatic impact on our understanding of the intelligence and mathematical ability of the designer. We would not be able to discover this relationship except by plotting it on a graph. Statistical or other mathematical methods would not make it obvious to us. Therefore, the designer had to use similar graphical design methods, (or a more sophisticated mathematical equivalent we have not yet discovered). In turn, this must mean he sat down with ruler and pencil and consciously laid out such scheme. My graph is merely a reflection of something he did nearly five thousand years ago.
But even this graph would not be possible if he did not fully understand exponential and logarithmic relationships. He had to know that a value of B near one would provide a regression line that appears linear. This means that he must have attempted many trial plots, with use of Pi and e to provide numbers we could easily recognize. He had to have great finesse in higher mathematical relationships. He truly was a genius.
Highly disturbing is the fact that we have not progressed in our modern thinking to the point that we can arise above intellectual attitudes about ancient Egyptian cults, nor have we possessed the equivalent intellectual finesse to see through his design. How many “experts” are willing to accept that the pyramids were all tied together in one grand design, or that such ancient knowledge could have existed.
Once again we can see that Cole's data causes the Giza 1 case to fall considerably off the line and again places doubt on his measurements. If they are more correct than Petrie's they would refute the correlation for that data point. (I do not show the data for the Giza 1 sockets, which were merely construction control points.)
As we unfold the mathematical relationships we can more readily recognize why the placement of Giza 2 before Giza 1 in chronology is forced upon us, even though it violates the accepted chronological order obtained from historical and archeological data. However, this would not refute the correlation point on Figure Five since that point is independent of chronology.
![]()