ERNEST MOYER'S RESEARCH
THE FOURTH DYNASTY
GREAT PYRAMIDS OF EGYPT
GEOGRAPHICAL ORIENTATIONS
And
SIDE DEVIATIONS
PART FIVE
Copyright 2001, by Ernest P. Moyer
Control Finesse
In order to address the problems created by the strong linear correlation of Figure Five I examined the data of Table II more rigorously.
I noted that the spread of individual side deviations from the respective pyramid mean always seemed to follow certain patterns. For example, I ranked the absolute values regardless of geographical side or sign. That is, for Meydum they were 21.00, 12.00 8.30, and 1.40. The values for the Bent Wall were 11.00, 5.40, 3.70, and 2.00. Since Figure Five shows that the magnitude of the respective pyramid deviations were dependent on their sequence in the total project, I calculated the ratio of the individual deviations to the mean for each structure. This normalized the deviations, or put them on equal footing to permit more rigorous evaluation. I show these normalized results in the following table.
TABLE III
Normalized Side Deviations in Parts/10,000
| Pyramid | Mean Deviation |
N | E | S | W |
| Meydum | 10.70 | -0.78 | +1.96 | -0.13 | -1.12 |
| Bent Wall | 5.50 | -0.67 | -0.98 | -0.36 | +2.00 |
| Giza 2 | 1.70 | -2.06 | +0.22 | +1.41 | +0.41 |
| Giza 1 Core | 1.20 | +0.77 | -1.92 | +0.21 | +0.92 |
| Giza 1 Case (P) | 0.72 | +0.90 | -1.67 | +1.08 | -0.31 |
| Giza 1 Case (C) | 2.40 | -1.80 | -0.18 | +1.88 | +0.26 |
If we now take these calculated values and rank them by numerical magnitude we obtain the following:
TABLE IV
Normalized Side Deviations Ranked by Magnitude
| Pyramid | Largest Deviation Side |
2nd | 3rd | Smallest Deviation Side |
| Meydum | 1.96 | 1.12 | 0.78 | 0.13 |
| Bent Wall | 2.00 | 0.98 | 0.67 | 0.36 |
| Giza 2 | 2.06 | 1.41 | 0.41 | 0.22 |
| Giza 1 Core | 1.92 | 0.92 | 0.77 | 0.21 |
| Giza 1 Case | 1.67 | 1.08 | 0.90 | 0.31 |
| Arithmetic Average |
1.92 | 1.10 | 0.71 | 0.25 |
| Cole Case | 1.88 | 1.80 | 0.26 | 0.18 |
I show Cole’s Case values separately because we have now established that his measurements do not possess the refinement necessary to become part of this study.
A brief look at the last table quickly reveals another
startling result. The normalized values of the side deviations with
respect to the mean, without regard to sign or side, show that the values for
the individual pyramids are very close to one another in the respective
columns. The largest normalized side deviations are spread from 1.67 to
2.06. The second largest deviations are spread from 0.98 to 1.41.
The next two columns show a continuing monotonic decrease indicated by the
mean values.
This means that the designer/builder predetermined how the
side deviations of each structure would vary in magnitude, but not with
respect to side or sign of the difference from the deviation mean.
If we plot the mean values, while showing the range among
the five structures, we obtain the following.
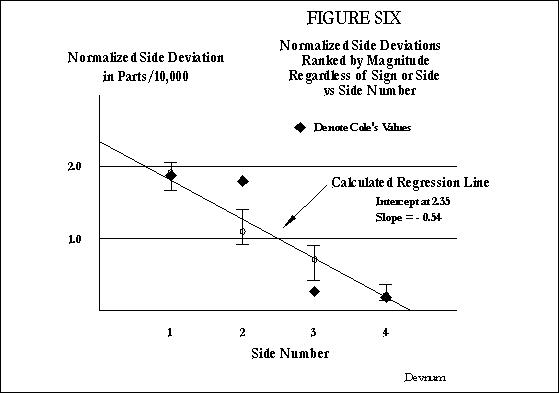 |
The open circles are the arithmetic means for the five structures. The vertical lines and bars show the spread in values. The closed diamond shows Cole’s values for Giza 1 case.
Once again we have an amazing arrangement of data, dramatically illustrated by graphical plot.
We can easily recognize that the variation by side, when
plotted against the side number, shows a linear correlation relationship. The
calculated regression line has an intercept at a normalized 2.35 parts/10,000
and a slope of -0.54 parts/10,000 per side.
To further enhance his mathematical finesse the designer used
values which again show neat numbers. When I calculated the regression
line I found that the average X value was 2.5 and the average Y value was 1.0.
The designer not only knew linear graphical relationships, including exponential and logarithmic forms — he also knew what it meant to normalize data, and to reduce them to a common reference.
In order to achieve such relationships the designer had to know in advance the methods of each structure. He designed Meydum to be larger in deviation, and Giza 1 to be far closer. But he did so in such a way that the normalized values would fit neatly in relationship as shown on Figure Six. In other words, he calculated the deviations to be related to the amount of geographical misalignment while relating them also to one another strictly on the basis of deviation. Meydum had the largest which, on an absolute scale would not appear related to the other pyramids, while on a normalized scale readily shows that relationship.
Figures Five and Six now show explicitly that Meydum was intended to be part of the overall pyramid project. It does not sit in isolation, related merely by chance as one might claim from Figures One and Two.
We also can see that the side deviations of the Menkaure pyramid violates this scheme, and cannot be included on the last two Figures. It was not intended to be part of the geometric project.
We see further that Cole’s measurements come into
increasing question. His values do not fit neatly on Figure Six. The second
and third sides are respectively far too high and too low. This fact
reinforces our respect for the superb measurements of Flinders Petrie, who
stands out above other men. Petrie was equal to the original designer in
his measurements; Cole was not.
The remaining casing stones found at Meydum may have been
intended to provide data to tie that structure to the other 4th dynasty
pyramids without ever having been completed. At some point, work on the
outer casing was suspended because it was no longer necessary.
The data of Figure Six might help us understand the range of errors, either in the construction, or in our measurements. I reviewed the maximum and minimum values for each side as shown in Table IV. I learned that of the eight limits on the Figure were due to the two Giza pyramids. The median points also were populated by the Giza pyramids. This merely tells us that the greatest errors took place where the requirements were the tightest. Since the constructions test our modern measurement abilities we cannot say from these numbers if the spread in data is due to the former or the latter.
One is tempted to “force” the averages to some
numerical clean value, such as 2.00 at side 1, 1.25 at side 2, and so on, with
a slope of -5.0, to obtain neater regression points, but I could find no clear
fit that would justify such manipulation of the numbers. The designer offered
us striking information without resorting to such artificial values.
![]()