ERNEST MOYER'S RESEARCH
GREAT PYRAMIDS OF EGYPT
GEOGRAPHICAL ORIENTATIONS
And
SIDE DEVIATIONS
PART SEVEN
Copyright 2001, by Ernest P. Moyer
Specific Relationship Among Structures (Continued)
Given this simple relationship between the side deviations
of Meydum and the Giza 1 Core, and the Bent Wall and Giza 2, it is
natural to ask what other relationships might exist. Perhaps there is a
connection in the sequence of absolute change around the four sides of each
structure and not merely differences from the respective means. A tabulation
of the sequence of the increases and decreases shows the following:
| Pyramid | NE | ES | SW | WN |
| Meydum | I | D | I | D |
| Bent Wall | I | D | I | D |
| Giza 2 | D | I | D | I |
| Giza 1 Core | I | D | I | D |
| Giza 1 Case | I | I | D | D |
Patterns emerge once again. Meydum, the Bent wall, and the Giza 1 Core all show the same sequence of length change around the four sides. Giza 2 is opposite in this sequence. The Giza 1 Case does not correspond to any of the other pyramids, but might have a relationship once again with the Bent and Flat pyramids — which remains unknown.
Since the arithmetic average of the absolute values
correlated so well with geographical orientations I plotted the absolute
variations for the four sides of each structure. I also used a logarithmic
scale to bring out the smaller variations with greater clarity. In addition I
plotted the values in the order of increasing difference from the mean,
regardless of geographical position, to study the variation control. See
Figure Nine A and B.
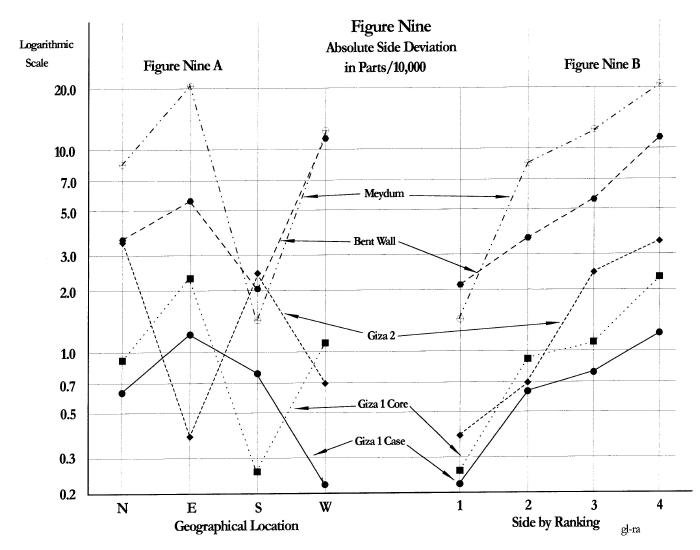 |
The tie between Meydum and the Giza 1 Core is immediately evident. The sequence of changes and the 10:1 ratio are easily seen.
Other relationships show. Except for the North side, Giza 2
is a mirror reflection of the Giza 1 Core. Refer to Figure Ten.
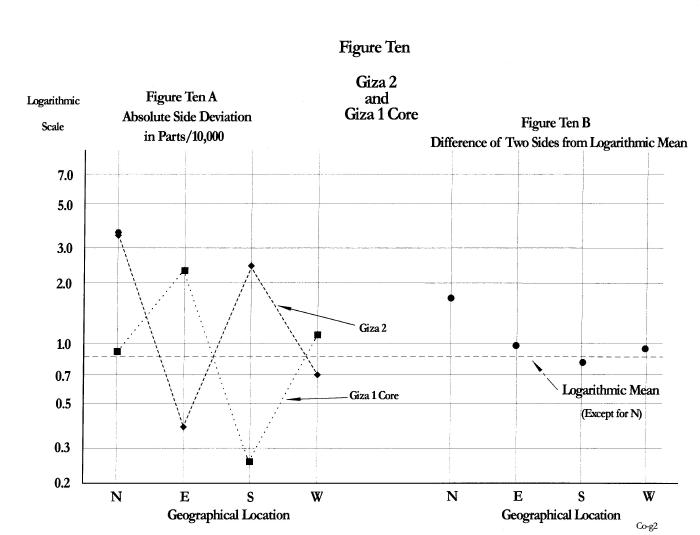 |
The south and west sides of the Giza 1 Core and Case are also mirror reflections of one another.
How do we know these last relationships were intended and not merely accidental? One must estimate the chances of such peculiar and curious connections being merely happenstance. Such idea becomes more and more absurd.
Numerical relationships among these structure variations are not immediately obvious; one must do a detailed analytical study as I have shown here to develop a full understanding of the architectural design.
The plot of the deviations according to ranking in Figure Nine B shows other patterns. Since this is a logarithmic plot the mean of the four sides for each structure follows the pattern shown in Figure Four. The gap between the Bent Wall and Giza 2 for the missing Bent and Flat pyramids is apparent on this plot. If those two pyramids were placed in sequence on Figure Nine B there might be nearly equal spacing between the maximum deviations of seven structures on the logarithmic scale (position 4). This scale would express the upper limits of the decay type curve shown in Figure Four.
This assumes that the designer had one side considerably greater than the mean for each structure, and one side considerably smaller, to produce the upward and downward extremes in sides one and four.
We see that of twenty data points only two do not preserve
ranking; those two are the South side for the Bent Wall, and the West side of
Giza 2. Figure Eight provides an explanation for these last differences from
the usual form shown in Figure Nine.
Other facts emerge from Figure Nine. The spread in deviations
from mean length for all structures covers exactly two orders of magnitude.
The largest deviation is in Meydum at 210 parts /100,000 while the smallest is
in the Giza 1 Case at 2.2 parts /100,000. This last fact is truly phenomenal.
It would mean the construction engineers controlled the Giza 1 Case side
lengths to better than 5 millimeters out of some 230 meters. Suggestion of
such tight control is also shown by the south side of the Giza 1 Core and the
east side of Giza 2. The former was built to 2.6 parts/100,000 (6
millimeters), and the latter to 3.7 parts/100,000 (8 millimeters). While we
might believe such numbers to be beyond the range of control by even modern
techniques the form of Figure Nine B brings serious pause. The plots do not
have the appearance of randomness for even the smallest side length
deviations. They appear to be fully under control by the pyramid engineers.
The analytical reliability of the data is conditioned by three factors: the ability of the builders to measure so precisely, their ability to construct so precisely, and Petrie's measurement precision.
Petrie gave 0.1 inch resolution or about one part/100,000 on his measurements at Giza. If he rounded off to the nearest 0.1 inch then his measurements probably had a precision of about 0.05 inches. He states that his first class survey points were fixed with an average probable error of 0.06 inches (1). The base of the survey, over 659 feet, was measured three times with a probable error of +/- 0.03 inches or +/- four parts per million. He also reported that he measured along the east side of Giza 1, thence along the south side, up the stone courses of the southwest corner, across the top, and return down the northeast corner. His error was less than 1/4 inch in 3,000 feet, or less than one part/100,000. Therefore Petrie's smallest reported side deviations probably are not far from the actual values.
Note that the mean side lengths of the respective
structures are virtually unaffected by the deviations. The maximum deviation
for the Giza 1 Case is about 1 part/10,000. Even the worst case deviation of
Meydum at 2.1 parts/1000 would not seriously affect the side length design
objectives. The builders held the deviations well below the side length design
goals. Thus it was possible to place the Giza 1 Core inside the Giza 1 Case
with the differences of deviation shown.
![]()