ERNEST MOYER'S RESEARCH
GREAT PYRAMIDS OF EGYPT
GEOGRAPHICAL ORIENTATIONS
And
SIDE DEVIATIONS
PART TWO
Copyright 2001, by Ernest P. Moyer
The Side Deviations
The data provide other
information, clearly indicated on Figure One. The individual side
orientations of Meydum differ from one another as much as 18'. The Bent
enclosure wall has a scatter of 11', while Giza 2 has 1' 52" maximum
difference among the sides. The Giza 1 core is within 1' and the case
within 37" (Petrie). (For 3' 33" value by Cole see discussion
below.) This trend shows a direct relationship between polar orientation
and side deviation from the mean pyramid length. The closer the structures
were oriented to the pole position the less scatter they had in their side
differences from the mean lengths. The engineers not only were continually
improving on orientation according to some grand design C
they also were continually improving on base construction to maintain
individual lengths to that same grand design.
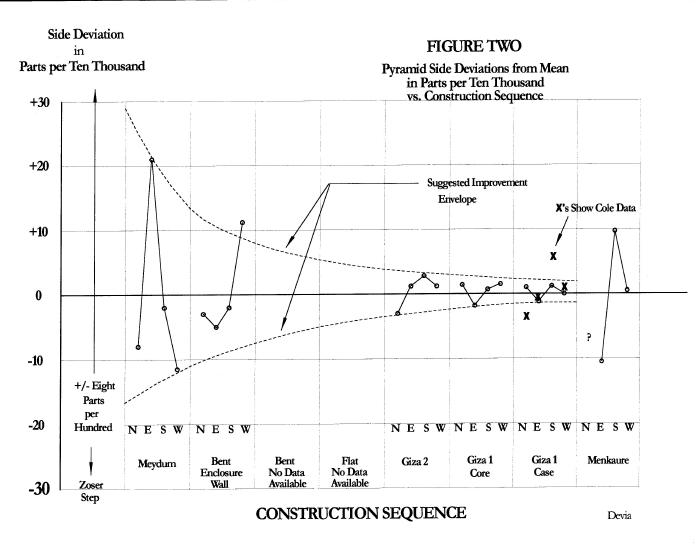
The data demand that we evaluate the latter. Table II shows the calculated values of base length differences in parts/10,000 from the mean length for the respective pyramids. In this form the data help quantify the continual increase in base length control from Meydum until Menkaure, when a relapse again occurs. See Figure Two. Although the normalized plot tends to accent improved control for larger structures a plot of the real errors shows a similar trend. The normalized plot is useful to show the level of control. Meydum was held to +/- 2 parts /1,000 maximum difference (30 centimeters) among its sides; the Bent enclosure wall was held somewhat tighter. Giza 2 was held to less than +/- 4 parts /10,000 (8 centimeters) while the Giza 1 outer casing was held tighter than + /- 1.5 parts /10,000 (3 centimeters). This is remarkable control for such large structures, hardly equaled in modern constructions. As Petrie noted for Giza 1, one could cover the error with one's thumb for a length of some 230 meters (1).
Calculated
Base Deviations From Mean Length in
Parts/10,000
and
Compass Orientations in
Minutes of Arc
(The Mean Lengths are in
meters.)
| Pyramid | Mean | N | E | S | W | Arithmetic Average of Deviations (Absolute Values) |
| MEYDUM | ||||||
| Length | 144.32 | -8.30 | +21.00 | -1.40 | -12.00 | 10.70 |
| Orientation | -24.41 | -35.40 | -23.60 | -20.60 | -18.10 | |
| BENT WALL | ||||||
| Length | 298.70 | -3.70 | -5.40 | -2.00 | +11.00 | 5.50 |
| Orientation | -12.45 | -4.60 | -16.70 | (?) | -16.10 | |
| GIZA 2 | ||||||
| Length | 215.263 | -3.50 | +0.37 | +2.40 | +0.70 | 1.70 |
| Orientation | -5.44 | -5.50 | -6.20 | -5.70 | -4.40 | |
| GIZA 1 CORE | ||||||
| Length | 228.638 | +0.92 | -2.30 | +0.26 | +1.10 | 1.20 |
| Orientation | -5.26 | -4.60 | -5.40 | -5.40 | -5.70 | |
| GIZA 1 CASE (P) | ||||||
| Length | 230.348 | +0.65 | -1.20 | +0.78 | -0.22 | 0.72 |
| Orientation | -3.72 | -3.30 | -4.00 | -3.70 | -3.90 | |
| GIZA 1 CASE (C) | ||||||
| Length | 230.351 | -4.30 | -0.43 | +4.50 | +0.26 | 2.40 |
| Orientation | -3.11 | -2.50 | -5.50 | -2.00 | -2.50 | |
The dashed lines on Figure
Two are intuitive estimates of the limits of builder control. Future
measurement on the two Dashur structures should show the Bent held to +/-
8 parts/10,000 on side lengths with the Flat held to +/- 5 parts/10,000.
Giza 2 again appears to fit in the sequence before Giza 1, rather than
after.
Again the Step and Menkaure Pyramids could serve as terminus a quo and terminus ad quem, respectively.
Note that Giza 2 and the Giza 1 Core can now be distinguished for difference in control, which did not show in the compass orientations. This fact is important to our data analysis.
 |
![]()