ERNEST MOYER'S RESEARCH
GREAT PYRAMIDS OF EGYPT
GEOGRAPHICAL
ORIENTATIONS
And
SIDE DEVIATIONS
PART THREE
Copyright 2001, by Ernest P. Moyer
The Logarithmic Decay Curves
The data can offer a more
solid inference that the structures were controlled to produce the form of
the graphical plots shown in Figures One and Two -- if we do our homework.
As a research engineer I was thoroughly familiar with natural decay processes, and how they show on data plots. Many examples can be drawn from nature: radioactive decay, the decay of charge on an electrical capacitor, the decay of organic materials, and so on.
Natural decays follow logarithmic forms. For example, the amount of loss may be one-half measured value per unit of time, in succeeding half-value increments. For radioactive decay this is called the half-life. This is expressed by the equation:
N = N0 e - xt
where N0
is the number of atoms in a sample at the beginning, and N is the number
remaining after time "t." "x" is the decay rate,
different for different materials.
Figures One and Two
demonstrated natural decay curves as well as any I had ever seen. I
naturally wondered how they would look if plotted on logarithmic scales.
Figure Three shows a graph of the mean orientation among structures on a log scale. This produces a linear decline according to pyramid number. The measured values hold amazingly well to a mathematical equation expressing the decay, with small variance from the regression line.
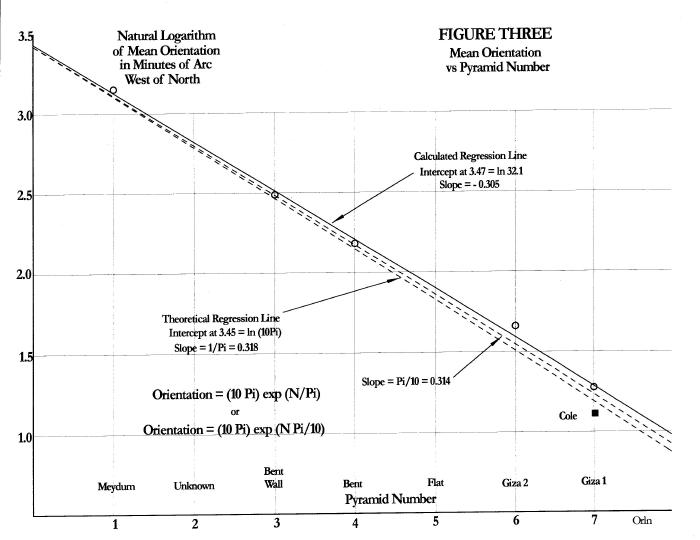 |
The mathematical expression for this line is:
Y = A (intercept at 0
pyramid number) - B (slope) X Pyramid Number
or
Y = A + B X
where the orientations are expressed in the natural logarithm of the original number, while the pyramid numbers are expressed on an ordinary linear scale.
For those who may not be acquainted with logarithms, two forms are commonly used in mathematics and the physical sciences. The first is called "common logs" based on multiples of 10. 100 = 1, 101 = 10, 102 = 100, and so on. The second is called "natural logs" based on an important physical constant we symbolize by the letter e = 2.71828. e0 = 1, e1 = 2.71828, e2 = 7.389, and so on. e most often expresses the rate of natural decay processes.
In following discussion I shall use the symbolism of log to denote common logs, and ln to denote natural logs.
We may argue that the data
from the pyramids are not natural; they do not come from natural
processes. They are manufactured by human intelligence. However, the
data plots show that the designer prearranged his structures to express
a curve similar to natural decay. He probably did so because he knew
that anyone competent enough to detect the form of the curves would be
familiar with natural processes.
After I calculated the intercept and the slope of the orientations from the data on the basis of a natural decay curve I bumped into another amazing value. The intercept was 10 Pi and the slope was very nearly 1/Pi or possibly Pi/10. I show both the regression line calculated from the data (solid) and the theoreticals (dashed) on Figure Three.
We saw in the Great Pyramid Pi chamber that the designer used (Pi X ln 10) for one of his dimensions to show his knowledge of higher mathematics. Here he displays it with the intercept values and the slope of the logarithmic decay.
Do other solutions exist for these curves? Possibly. I did not rigorously search for other solutions. Other persons may find other efficient results.
Remember, if we are to maintain scientific integrity we must accept solutions that are the most conservative and direct.
We can see how well the designer/builder held the successive pyramid mean orientations to satisfy the mathematical requirements for a natural decay curve.
In my analysis I discovered that another unknown structure may have been part of this grand project. It would fall after the Meydum pyramid and before the structures at Dashur. This discovery came about when I plotted the data for the Bent and Giza structures to find that the Meydum pyramid value was too high on the graph. If I assumed another unknown structure it then fell neatly as part of the regression line calculated from the later structures.
Figure Four shows the same mathematical intent expressed from the mean deviation of the pyramid side lengths. Here the builder maintained the mean of the lengths to tighter control around the regression line. This suggests that his ability to measure lengths was better than his measure of compass directions. The intercept of this line is 15.9. This is again a unique number. It is 100/2 Pi.
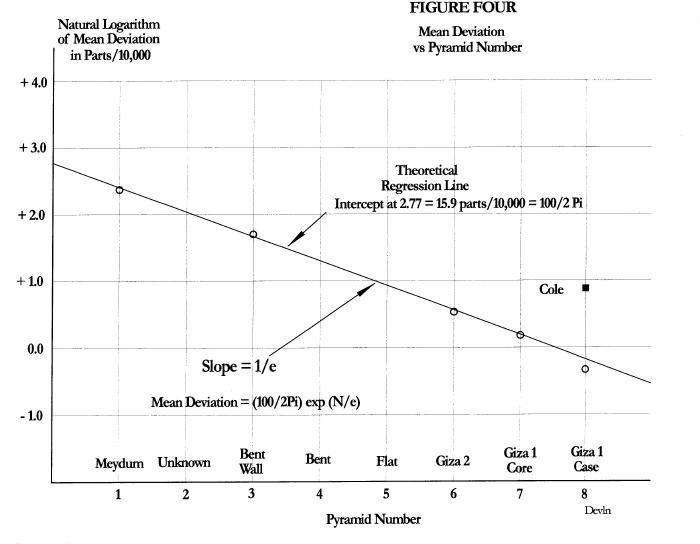 |
Here he used another amazing slope = 1/e.
When I plotted the actual regression line, and one based on the theoretical ideal, I could not readily distinguish them on the graph.
Note that in both Figures Three and Four Coles measured values fall considerably beyond the regression lines calculated from Petrie's data. This means that Cole's measures were not equal to the pyramid construction. In fact, Petrie was so excellent in his measurement abilities that we do not know if the variations from the regression lines is due to errors on the part of the builder or errors in Petrie's measures. Petrie was truly superb in his ability to provide measures that permit this data analysis.
The Cole value shows the difficulty we would have in the data analysis if Petrie had not been so careful. In fact, the analysis would not have been possible if we were to depend on the someone like Cole. Few men in modern times are equal to Petrie for his fine observation and incomparable use of measuring equipment.
We now have the designer catalogued with several different mathematical forms: (Pi X ln 10), Pi/10, (or 1/Pi), 10 Pi, 100/2 Pi, and precise knowledge of logarithmic decay curves expressed according to the natural base e.
Note that the intercept of 10 Pi on the Orientation plot is a radian measure, where I have scaled it in minutes of arc. The intercept of 100/2 Pi for the Deviation plot is in the inverse of radian measure but the designer chose this value for the convenience of the scale.
The exponent for the Orientation is in units of radian measure while the exponent for the Deviation is in units of the natural number e.
The designer was limited to
certain choices in order to bring out his mathematical knowledge while
remaining within the boundaries of the practical designs. He chose
values that would be more apparent to us from our mathematical
knowledge, to quicken our recognition of his design intent.
We now know that Meydum was definitely intended to be the first structure of the project; the intercepts would not be so mathematically neat if another structure intervened between Meydum and the zero pyramid number values.
The data analysis requires that the unknown structure must fall between the Meydum pyramid and the Bent Wall. It might be in the core of Meydum, some other enclosure wall, or a structure not now recognized or measured.
I shall add to this catalogue as I work through the pyramid designs. I shall later also discuss the dramatic impact of this study on our understanding of ancient human history.
Four elements permit these graphical displays. One, the mathematical agility and ingenuity of the original designer, two, his construction control, three, Petrie's superb measurement ability, and four, my analysis.
Other elements affect our views of the meaning of the data.
![]()