The Fourth Dynasty Great Pyramids - Specific Relationships Among Structures
Ernest Moyer demonstrates non-random relationships among pyramid side deviations using logarithmic analysis, revealing equations with constants like 2π and 1/2π that match modern physics expressions, showing extraordinary design sophistication.
Copyright 2001, by Ernest P. Moyer
Specific Relationship Among Structures (Continued)
Since the logarithmic plot of Figure Nine was beneficial in separating the data I decided to replot Figure Five on a logarithmic scale for the absolute side deviations and with separation of the individual data points in each structure against the polar orientations, Figure Eleven. This more clearly shows the small base length differences as a function of geographical orientation.
Figure Eleven: The Remarkable Band Structure
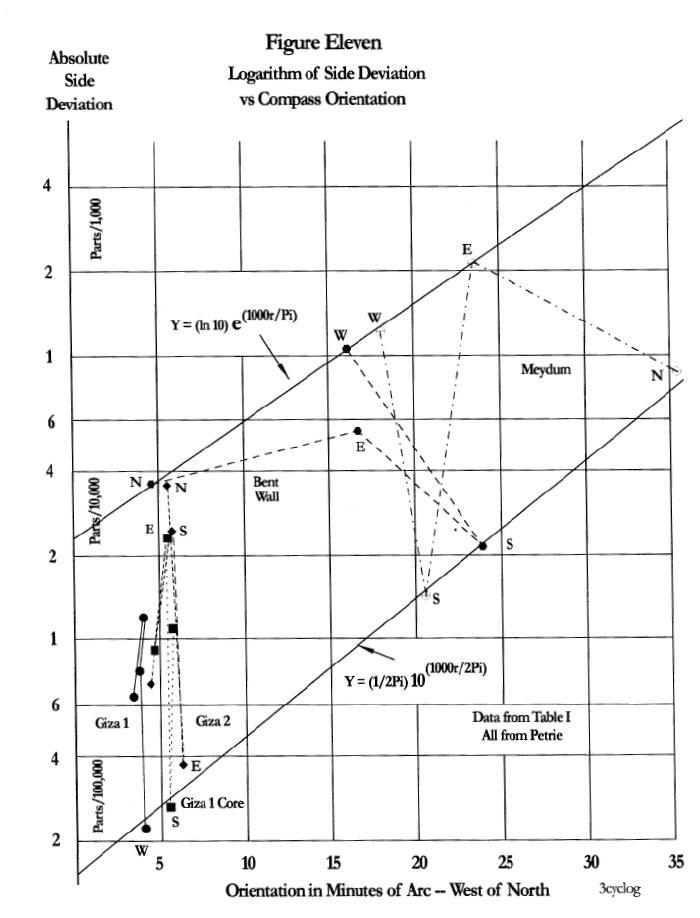 Figure 11: Logarithmic plot of absolute side deviations vs geographical orientation
This graphical plot is even more remarkable than the extraordinary results thus far discussed.
Six data points for the sides of each structure with the least deviation, except for the Bent wall, are scattered closely on either side of a straight line on the logarithmic plot. The north side of Meydum also falls on this line.
The only point with any significant difference from this generalization is that of the Bent Wall South side. Maragioglio noted the probable error in the 38' 50" value for this side. From this graph we can now suggest an answer to that error. A double scribal mistake probably transcribed a "2" as a "3", and a "3" as an "8." If the value were 23' 50" it would fit on the graph at the band limits defined by the other data points.
The Lower Band Equation
This lower line in Figure 11 can be described by the equation:
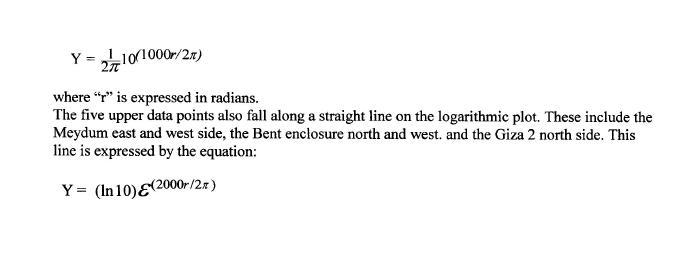 Mathematical expression for the lower regression line
The remaining nine points appear to be grouped also in relative positions within the band. (I do not mark the geographical position of the clustered Giza group to avoid cluttering the display.)
How regretful that we do not have data from the Bent and Flat pyramids. One can see the "open" space in this band where the Flat and Bent data would probably fall. We noted this also with Figure Nine.
Note that this band is slightly more than one order of magnitude.
Physical Reality of the Equations
Are these equations real?
They are mathematically real. Anyone can confirm their placement on the graph.
Are they unique? Are they the one and only solution to the scatter of the data points?
They have the form of physical expression, not merely mathematical. They are typical of what one finds in the physical sciences. Use of 2π shows exactly what we find in modern technical equations. For example the velocity of light and electromagnetic waves in free space is expressed by the equation:
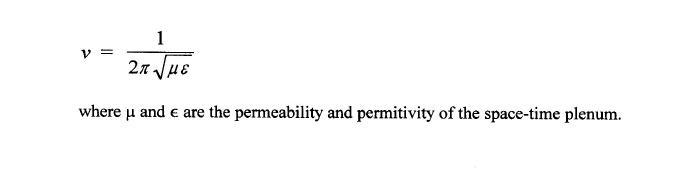 c = 1/√(με) where μ and ε are the permeability and permittivity of the space-time plenum
The more we study the ancient Egyptian pyramid design the more we become impressed with the true genius of the designer/construction engineer.
Histogram Analysis: Non-Random Grouping
The nonrandom grouping of the data on Figure Eleven can be examined by the use of histograms, Figures Twelve A, B, and C.
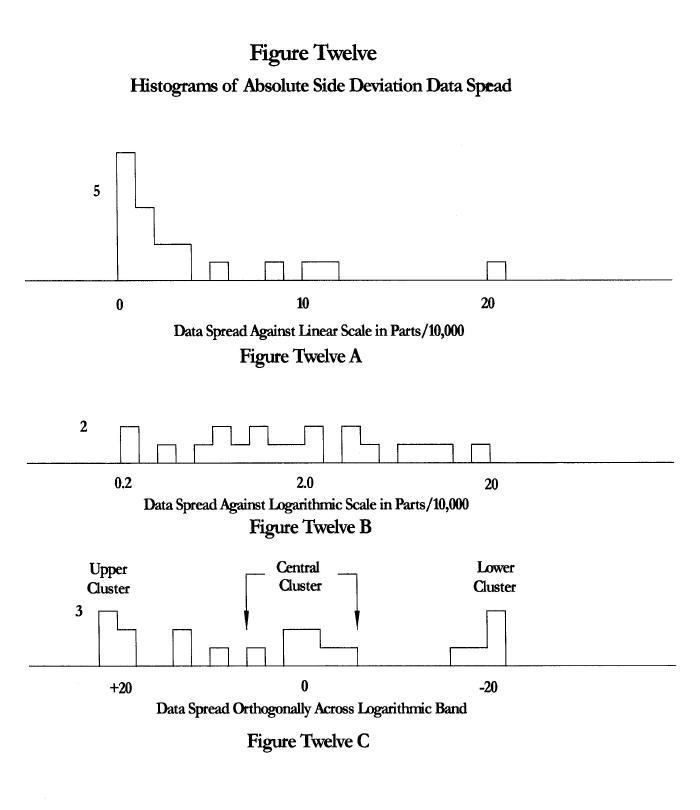 Figure 12: Three histogram views showing data distribution
Figure Twelve A: Linear Scale
If we take the absolute side deviations and plot them on a linear scale of twenty divisions we obtain Figure Twelve A. The deviations are clustered close to zero, as we would expect for random variations in control, perhaps as a normal distribution. From this histogram we might estimate how well the builder held to the mean base lengths, without any ulterior motive in their scatter. If we took this view we would make a mistake of such proportions we would entirely miss his design objectives.
Figure Twelve B: Logarithmic Scale View
If we look broadside into Figure Eleven from the logarithmic scale, with twenty equal divisions, we obtain the histogram of Figure Twelve B, extending from 2 parts/100,000 to 2 parts/1,000. This gives almost a linear distribution on the logarithmic scale. Clearly, this does not follow a normal distribution of random errors around the mean base lengths. But again, this does not tell the whole story. While it might alert us to something peculiar in the control of the pyramid side lengths we would not fully perceive the arrangement of the data.
Figure Twelve C: Orthogonal Clustering
Only by a full display of the data can we come to better grips with the design intent. If we plot the data points as they are grouped orthogonally across the regression band of Figure Eleven, with twenty-two equal divisions, we obtain the histogram of Figure Twelve C. Now it becomes more evident that the data cluster into three main groups, with two at the upper and lower band limits and one at the midpoint of the band. Only three points on the positive side do not fall in these clusters. The clusters confirm that we have found a nonrandom relationship among the data.
The Power of Data Manipulation
In any grouping of data we can manipulate the display to show relationships, a practice at the roots of scientific inquiry. From such displays we then develop theoretical models. If the models are specific we can derive mathematical equations to more explicitly define them. In this case we have demonstrated that the logarithmic plot reveals a bona fide relationship among the IVth dynasty structures. The patterns are so clear we can formulate precise mathematical expressions.
Regression Analysis
If we accept the validity of the above equations to define the band limits we can calculate the intercepts and the slopes of the two lines from regression analysis. Within the range of error and resolution reported by Petrie:
Lower line (from six data points):
- Intercept: 0.152 × 10⁻⁴
- Slope: 0.0486/minute of arc
Upper line (from five data points):
- Intercept: 2.25 × 10⁻⁴
- Slope: 0.0412/minute of arc
Converting to Radian Measure
The slopes seem innocent enough until converted to radian measure:
Lower slope becomes 1000/2π per radian to the common base 10, within 5%.
Upper slope is 1000/π (2000/2π) per radian to the natural base e, within less than 1%.
Furthermore the intercepts are also:
- Less than 5% from an ideal of 1/2π for the lower
- About 2% from an ideal of ln 10 for the upper
Note that the intercept ln 10 is associated with the natural base while the intercept 1/2π is associated with the common base.
The upper calculated regression line is so close to the theoretical line we cannot distinguish them on the plot. The lower calculated regression line would also fit on the theoretical line if only one data point, the Meydum north side, were in error by 2 parts/10,000 or 3 centimeters.
Design Constraints and Placement
If the side lengths and orientations were consciously chosen by the architects consider how the pyramids were placed in their mean positions, and in their individual side positions:
- If the mean polar orientations were skewed more from the north the data points would fall farther to the right on Figure Eleven
- If the mean side deviations were larger the data points would fall higher on the plot
- The mean positions determine a centroid for each structure
- The centroids determine the form of Figure Five and the relative positions of Figure Eleven
- Individual data points then locate around the centroids
The core and the case for Giza 1 do not have side deviations that reach the upper regression line of Figure Eleven; there is a limit on their maximum deviation to achieve their mean deviations. If their mean side deviations were too high it would upset the linear form of Figure Five. Therefore, only the lower data points, those sides closest to the mean, could be used to determine the lower band limit of Figure Eleven. (Assuming that design criteria kept all data points inside the two band limits.)
Giza 2 had sufficient mean side deviation to permit one of its sides to help define the upper band limit of Figure Eleven while also helping to define the lower band limit.
The Bent Wall Anomaly
The Bent wall is curious in that it is opposite to Giza 1 in placement on the graph; two of its sides help define the upper band limit. Since the lower band limit is about an order of magnitude lower than the upper, a data point falling on it has little effect on the value of the mean deviation.
Ernest Moyer is author of "Our Celestial Visitors," in which he thoroughly examines the UFO and abduction phenomenon, with much new material never before published.