The Fourth Dynasty Great Pyramids - Cole's Data and Construction Control
Ernest Moyer compares Petrie's extraordinary measurements with Cole's inadequate verification attempt, demonstrates construction control to 0.2 millimeters, and reveals the construction sequence through masonry quality analysis.
Copyright 2001, by Ernest P. Moyer
Cole's Data
We have repeatedly encountered the fact that Cole's measurements, intended to confirm or deny Petrie's exquisite observations, were not adequate to this data analysis. He entitled his paper Determination of the Exact Size and Orientation of the Great Pyramid of Egypt. As he concluded from his methods, in the final sentence of the report: ". . . thus giving additional confirmation that the size and orientation of each side as found above is very close to the truth."
Well, it may have been close to the truth, but not good enough.
From his remarks Cole's effort seems to have been motivated in part by the unbelievable accuracy of the pyramids. Cole's work apparently was sponsored to show that the Great Pyramid could not have been built to the tolerances and resolution implied by Petrie's measurements. Cole set out to demonstrate such fact — and partially did so.
With the mindset of modern godless scholarship, and with the notions of superstitious cults as the foundational motivation of pyramid building, we do not have objective determination of pyramid reality.
Figure Thirteen: Comparing Petrie and Cole
In order to more vividly compare Cole's measurements with those of Petrie, I replotted the data for Giza 2 and the Giza 1 Case and Core on an expanded scale, and with the actual signs of the deviations, Figure Thirteen.
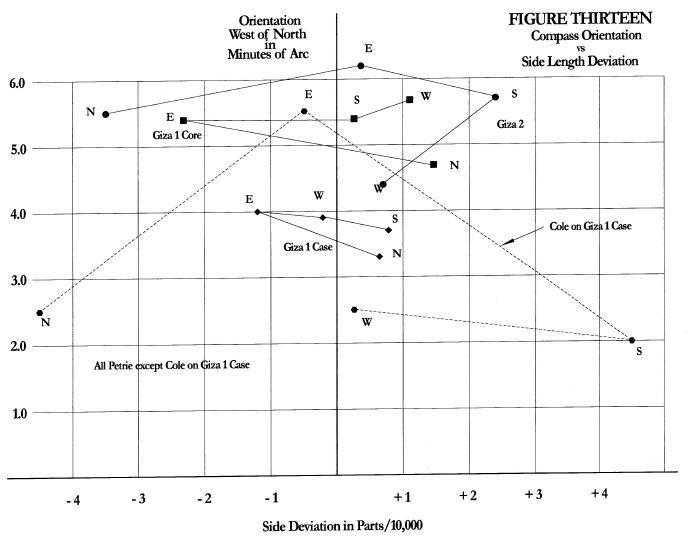 Figure 13: Comparison of Petrie and Cole measurements showing expanded scale
Several facts are immediately evident. Petrie's data shows ever diminishing values for the orientation and deviation with the projects progressing from Giza 2 to Giza 1 Core and on to the Giza 1 Case. From this graphical display we can easily grasp how the orientations of the Giza 2 and the Giza 1 Core are similar to one another while the deviations are smaller in the latter. The Giza 1 Core data are actually enveloped by the Giza 2 data. We can also see how the Giza 1 Case falls below those, with increasing refinement in construction and measurement by Petrie.
But the measurements by Cole are scattered beyond even Giza 2, with only the orientation average of Giza 1 anywhere near the values measured by Petrie.
Petrie's Uncanny Accuracy
Petrie's numbers cannot be simply coincidental. The IVth dynasty structures fit well defined regression lines and graphical displays. His excellent accuracy is especially striking in Figure Eleven for the lower values of the Giza structures. Both the builders and Petrie had to control and measure to better than one part/100,000 (2 millimeters); otherwise the fit to straight lines could not be made on that graph with such close proximity to the theoretical ideal.
This incredible accuracy does, indeed, stretch one's credulity.
Petrie and his colleagues measured the Meydum and the Bent structures several years after Giza. He could hardly have known how well the data would fit together and support one another. He certainly could not have schemed to provide such unique data. Maragioglio described Petrie's measurements as a peculiar accuracy. Perhaps a better term would be uncanny.
The discrepancies between Petrie and Cole show that the very fine precision of construction for the Giza pyramids is at the limits of modern measurement techniques and further accents their remarkable nature. The ancient builders achieved construction control which equals or exceeds modern methods. Those structures challenge modern abilities.
Future measurements made to verify the results of this study must be performed at an accuracy and precision matching those of the builders, certainly as good as Petrie. They must be much better than those demonstrated by Cole.
The Construction Sequence Evidence
Once again, if we place Giza 2 in sequence according to archeological assignment it falls outside the natural position shown in all the data plots. It also falls outside the scheme of general developmental improvement during the great pyramid era. This developmental improvement is shown in other ways.
Masonry Quality Progression
In Petrie's comments on Giza 2 he noted the inferior core masonry compared to Giza 1 with its rounded and carelessly shaped blocks as well as the inferior quality of the casing stone. He ranked Menkaure next to Giza 1 in the high quality of the masonry, not matched in other pyramids.
If, according to archeological assignment, Giza 2 were built after Giza 1 it would mean the builders reverted to inferior stone work but then returned to the superior quality for Menkaure.
Petrie also ranked the Flat and the Bent as next below Giza 2 in general quality of work and case masonry, with the Bent somewhat inferior to the Flat. His assessments would place the skill of the masons in the sequence:
Meydum → Bent → Flat → Giza 2 → Giza 1 = Menkaure
This evolution of masonry skill agrees with the sequence defined by the data plots.
The Lost Techniques
These observations also show that the masons remembered their trade for the Menkaure pyramid but that the refined engineering techniques of measurement and construction control were either lost or consciously avoided to provide a delimiter on the great pyramid construction project.
Other evidence reflects on pyramid evolution until Menkaure, when the high quality of pyramid technology suddenly was lost.
Construction Technique Evolution
The Meydum pyramid continued the practice of IIIrd dynasty construction with layers of stone sloping inward to prevent collapse. Sloping face and backing blocks were used in the Bent. But the Flat used flat face and backing blocks, a new technique continued at Giza.
Petrie remarked that the impression of the Dashur pyramids, from their general work and design, was that they were more archaic than Giza 1: ". . . the builders seemed to be feeling their way, rather than falling off in copying existing models" (as in later dynasties). Giza 2 showed this continuing improvement in skill and care.
The Giza 1 Dichotomy
But when he came to Giza 1 he noted the beginning of failure in the midst of extraordinary skill. He was impressed with the brilliant workmanship and exquisite refinement on one hand and astonished with equal carelessness and clumsiness on the other:
- The casing stones were shaped and laid with an accuracy that left only a hairline film of mortar between their sides over several meters length
- The joints of the entrance passage and the Queen's chamber and the finely dressed stones of the King's chamber were equal in achievement
- But the stones of the Grand Gallery and the small antechamber leading to the King's chamber were crudely dressed
- The exterior of the pyramid was leveled with the utmost care but the King's chamber had a "hundred times the error" in its short length
Petrie's Explanation
Petrie's explanation for this curious discrepancy was "that the original architect, a true master of accuracy and fine methods, must have ceased to superintend the work when it was but half done. His personal influence gone, the training of his school was not sufficient to carry out the remainder of the building in the first style. . . ." This suggests that the exquisite workmanship often found in the early periods, did not so much depend on a large school or widespread ability, as on a few men far above their fellows, whose every touch was a triumph.
This is the theme for explanation of the Great Pyramid Project. A few outstanding men, far above their fellows, whose every touch was a triumph, designed and superintended the building of those grand structures.
The Abrupt End at Menkaure
The abrupt end to this influence is attested in other ways in the Menkaure pyramid. Not only did the builders not hold to the fine tolerance on base length and orientation — they did not complete the outer casing and the existing casing was not dressed.
From that point pyramid technology continued to deteriorate. Although the Vth dynasty pyramids at Abusir had fine outer casing the general bulk of the core was greatly inferior to preceding structures. Later dynasty pyramids were ". . . very poor work; merely retaining walls of rough broken stones, filled up with loose rubble shot in."
The Mournful Declension
Petrie eloquently expressed the general pyramid failure which began with Menkaure: "When we look at the mournful declension in the designs of Pyramid building, from the beauty of the fourth down to the rubble and mud of the sixth dynasty, the falling off in size as well as quality is merely part of the same failure."
Understanding Pyramid Evolution
From these brief remarks, and from analysis of the data, we begin to grasp pyramid evolution in more rigorous terms. Some extraordinary social influence took shape, either during the IIIrd dynasty or at the beginning of the IVth, to provide this amazing data display.
As I remarked earlier, this almost superhuman activity would be detected only if the designer/builder expected that at some point in the future someone would come along to open his secrets. Such exposure required two elements:
- The necessary refinement in measurements
- Someone who could open the mathematics of the design
Construction Control
The data displayed in Figures Three, Four, Five, Seven, Eight, and Eleven all provide evidence of how closely the builders could hold the compass orientations and side deviations to the design ideals. Hence they show the error of construction.
Mean Compass Orientations vs Theoretical Design (Figure Three)
| Structure | Difference (Minutes of Arc) |
|---|---|
| Meydum | +1.45 |
| Bent Wall | +0.21 |
| Giza 2 | +0.67 |
| Giza 1 Core | +1.78 |
| Giza 1 Case | +1.18 |
Mean Side Deviations vs Theoretical Design (Figure Four)
| Structure | Parts/10,000 | Centimeters |
|---|---|---|
| Meydum | -0.32 | 0.45 |
| Bent Wall | +0.22 | 0.66 |
| Giza 2 | -0.05 | 0.11 |
| Giza 1 Core | -0.01 | 0.03 |
| Giza 1 Case | -0.12 | 0.39 |
The data points for the compass orientations are all positive; they are all above the theoretical decay curve. This fact is due to the designer's desire to hold the linear correlation shown in Figure Five. For that reason they should be weighed against that criteria, and not merely against the theoretical slope of Figure Three. However, if looked upon in isolation from that fact, we can see that the builders held the mean compass orientations to no more than 2.0 minutes of arc different from the theoretical design goal.
One can immediately see that the mean side deviations were held more carefully than the compass orientations. The maximum difference is in the Meydum pyramid at 32 parts per million, or about one-half centimeter. The mean of the Giza structures were held to no more than four millimeters difference from the design ideals. This is truly incredible control.
Analysis from Figure Five
For Figure Five I calculated two ways: first, assuming the measured orientations were on the ideal value, I determined how much the side deviations differed from the ideal. I then reversed the process, determining how much the orientations differed from the ideal if the measured side deviations were exactly on the ideal.
| Structure | Side Deviation Difference (assuming orientations correct) | Orientation Difference (assuming deviations correct) |
|---|---|---|
| Parts/10,000 | cm | |
| Meydum | -0.50 | 0.72 |
| Bent Wall | +0.28 | 0.81 |
| Giza 2 | +0.02 | 0.04 |
| Giza 1 Core | +0.93 | 2.10 |
| Giza 1 Case | +0.10 | 0.23 |
These numbers are comparable to those obtained from Figures Three and Four.
I could have calculated the mathematical standard deviation of the numbers around the regression line but, since measures of standard deviation are based on random process in related variables, I felt such calculation would falsely portray the design control. We should remember that the builder could control the side deviations independently of the compass orientations. Hence such calculation would tend to smother useful information from the individual data points. We are evaluating the ability of the builder to achieve independent design goals, and not mere random variation in manufacturing processes where one measure is dependent upon the other.
We should also regard the fact that the mean side deviations were held tighter than the mean compass orientations. Hence the above table reflects a better estimate of differences in compass orientations than of differences of side deviations.
In spite of their control independence the two variables seem to be related. Except for Giza 2 they are each opposite in sign. The relative magnitudes also seem to follow one another.
Analysis from Figure Eleven
I used the same method in evaluating from Figure Eleven for both the upper and lower theoretical ideal.
From Figure Eleven — Lower Band:
| Structure | Side Deviation Difference | Orientation Difference | |
|---|---|---|---|
| Parts/10,000 | cm | Minutes of Arc | |
| Giza 1 Case W | +0.007 | 0.02 | -0.87 |
| Giza 1 Core S | +0.007 | 0.02 | -0.81 |
| Giza 2 S | -0.08 | 0.17 | 1.70 |
| Meydum S | -0.06 | 0.13 | -0.22 |
| Bent Wall S | -0.10 | 0.30 | -0.11 |
| Meydum N | -1.79 | 2.58 | 1.67 |
Again the incredible control can be seen for the lower values of the Giza pyramids, differing from the theoretical by an unbelievable 0.2 millimeters.
We must keep in mind that this value is based on a calculation assuming that the Orientation is the correct value.
The builder needed to hold the Meydum and Bent structures to much less control to achieve the desired placement on the data plots. The upper curve required less control than the lower.
Similar tabulations could be made from Figures Seven and Eight.
Ernest Moyer is author of "Our Celestial Visitors," in which he thoroughly examines the UFO and abduction phenomenon, with much new material never before published.