Joe Parr's Research Charts and Graphs
Scientific charts and graphs from Joe Parr's pyramid energy research, including experiment transfer data, sun-moon relationships, and particle vibration calendars.
Joe Parr's Research Charts and Graphs
The following charts contain proprietary information from Joe Parr's extensive pyramid energy research. These graphs document decades of experimental data regarding pyramid energy fields, particle transfers, and astronomical correlations.
Graph of Experiment Transfers vs. Bermuda Triangle Documented Losses
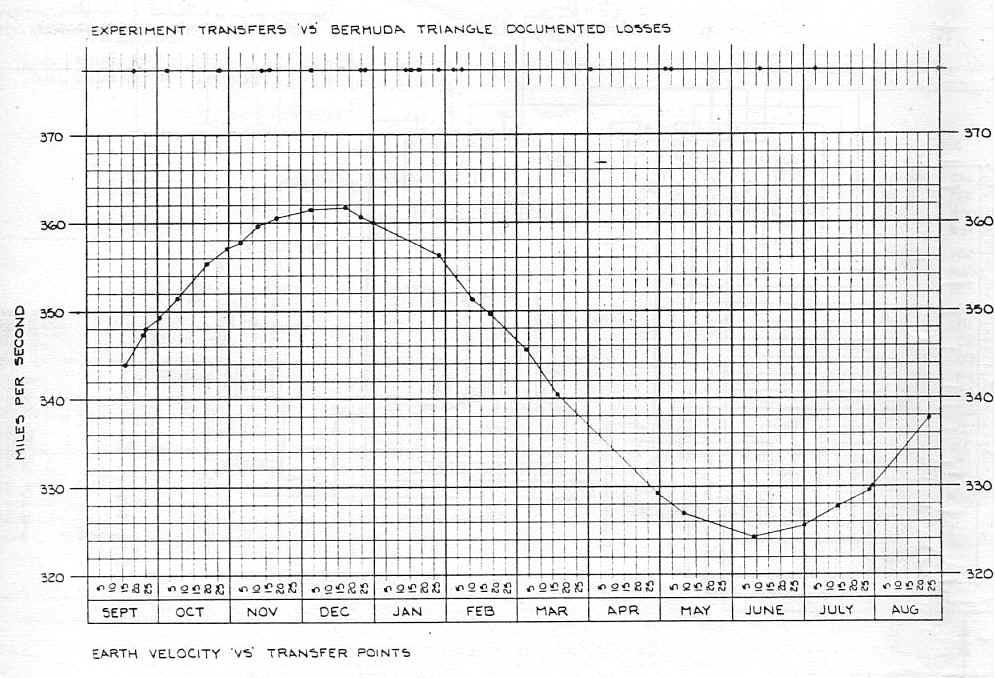
This chart correlates Joe Parr's laboratory experiment transfers with documented incidents in the Bermuda Triangle region, suggesting a possible connection between pyramid energy phenomena and the mysterious occurrences reported in that area.
Sun-Moon Angular Relationship
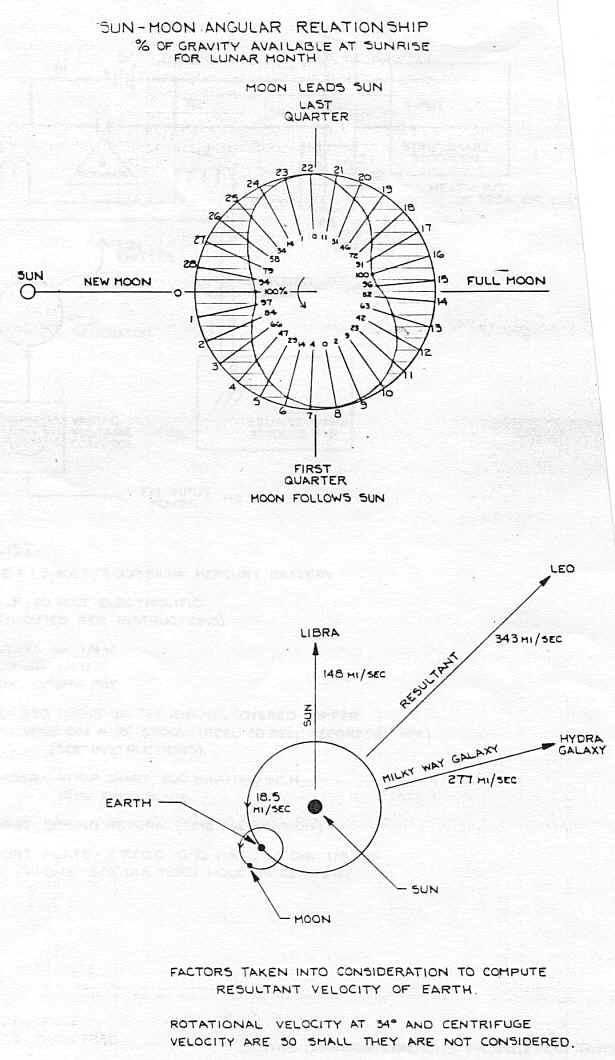
This diagram illustrates the angular relationship between the Sun and Moon as it affects pyramid energy experiments. Joe Parr discovered that the Orb surrounding pyramids expands and contracts with moon phases, and this chart documents those correlations.
Particle Vibration / Magnetic Field Calendar
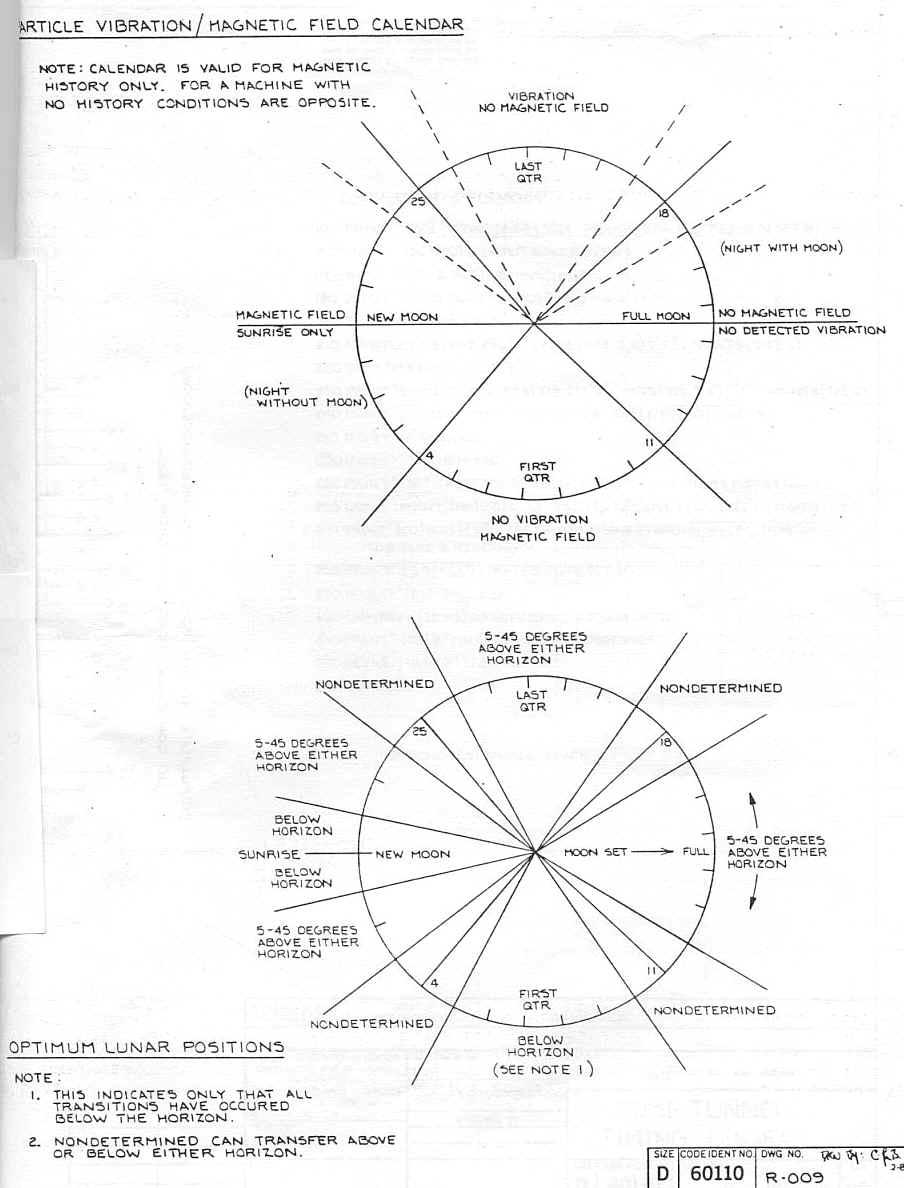
This calendar tracks particle vibration events and magnetic field fluctuations recorded during Joe Parr's long-term experiments. The data shows periodic patterns that correlate with astronomical events, particularly the conduits that occur when Earth passes through particle streams heading toward the Belt of Orion.
Note: These drawings contain proprietary information and may not be used for manufacturing purposes without written permission from Joe Parr.